

At the end of one of my prior posts I had mentioned Beats Data Shippers; the “nitty-gritty” of how logs get from your desired endpoints to your shiny ELK stack. If you are uncertain how this works and also somehow ended up here, then you are about to learn!
There are many different types of shippers, but for this post we will be focusing on Winlogbeat. We will also be utilizing Sysinternals’ Sysmon,
a custom Windows service that provides detailed information about process creations, network connections, and changes to file creation time.
Requirements
- Previously configured ELK stack
- Either Single-Node or Multi-Node
- A proper input & output filter enabled on Logstash
- Includes proper IPs and Ports as desired
- Windows VM or other Windows endpoint
NOTE: Please refer to one of my posts on creating an ELK stack, Creating a Multi-Node ELK Stack (Production) or Creating a Single-Node ELK Stack (PoC), for information about the above requirements if you are missing anything.
Configuring Winlogbeat
For this post, we will be working with a full ELK stack, which entails a node per each service (1 LS, ~3 ES, 1 KB). I will also be using a Windows 10 VM as my endpoint.
First, go to your endpoint and download Winlogbeat here:
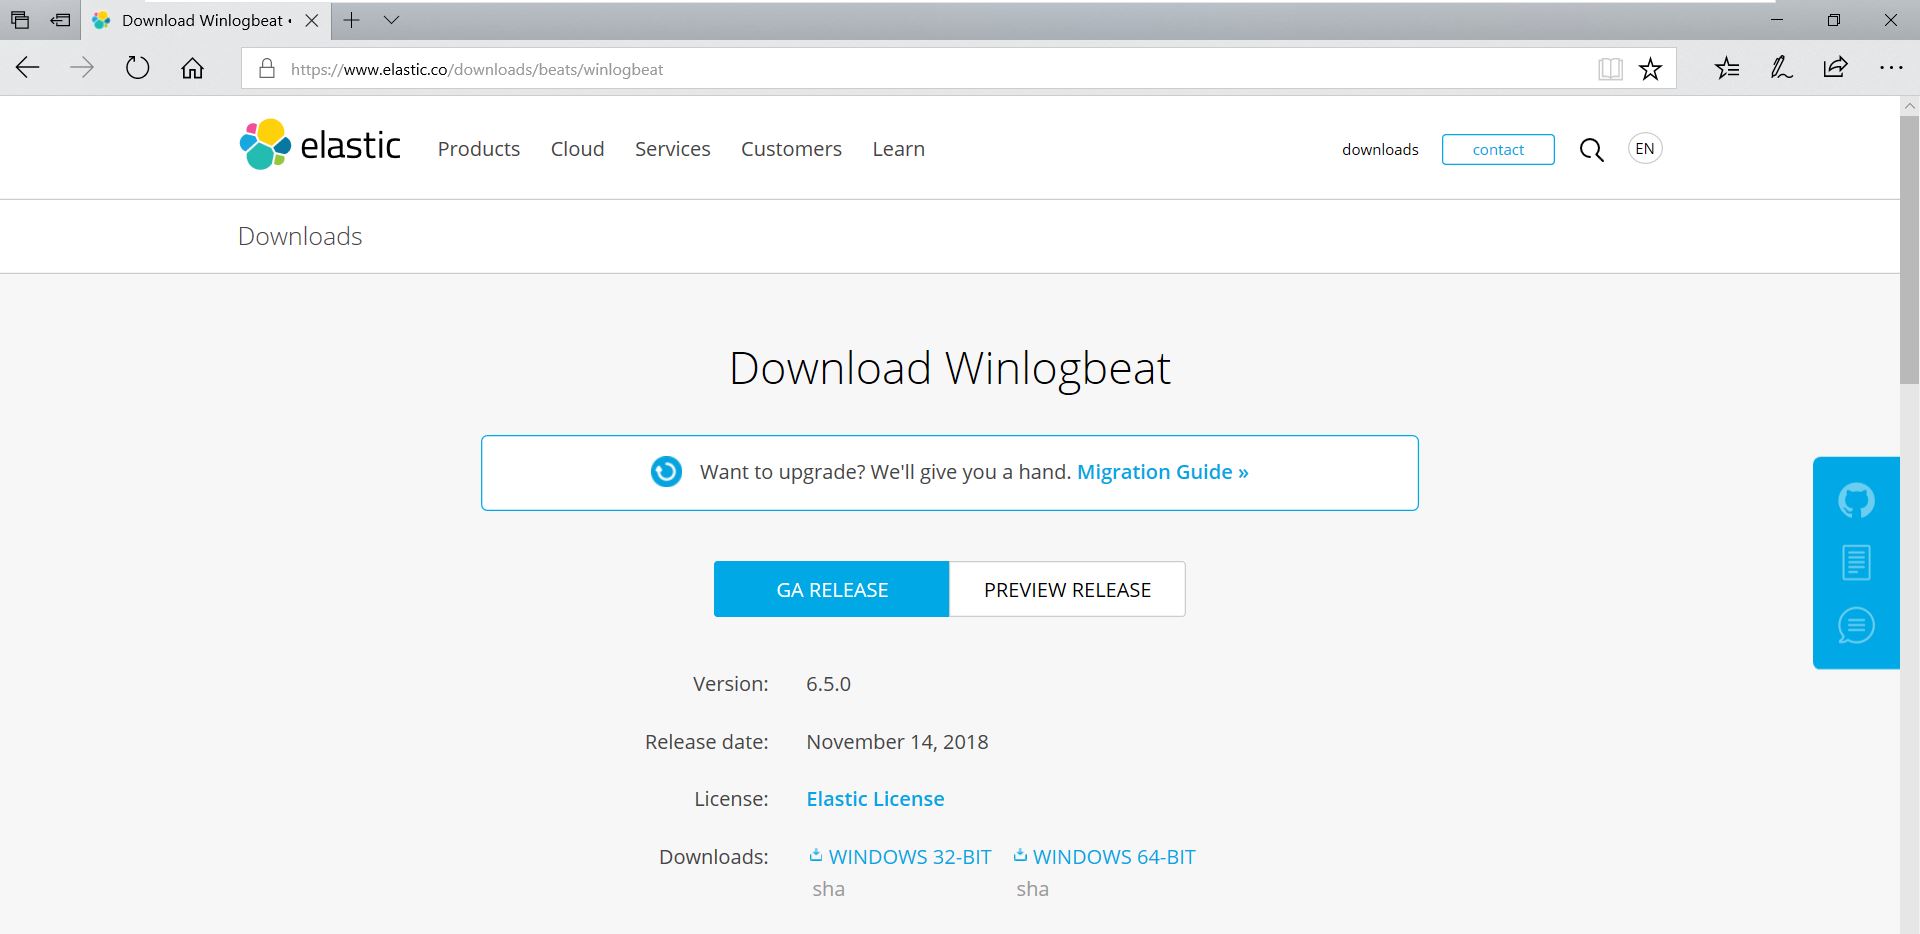
Extract and rename the resulting folder “Winlogbeat” and move it to the Program Files directory on your endpoint’s C drive. At this point, you should have a window that looks something similar to this:

Now you will need to configure Winlogbeat. To do so, right-click and edit the winlogbeat.yml file that came with the service in your favorite editor. I prefer Notepad++, but Windows Notepad will also work in this case.
At the top of the configuration file you will see a section called winlogbeat.event_logs, which is the section responsible for grabbing the appropriate log types from your Windows endpoint. Modify that section to match that of mine below:

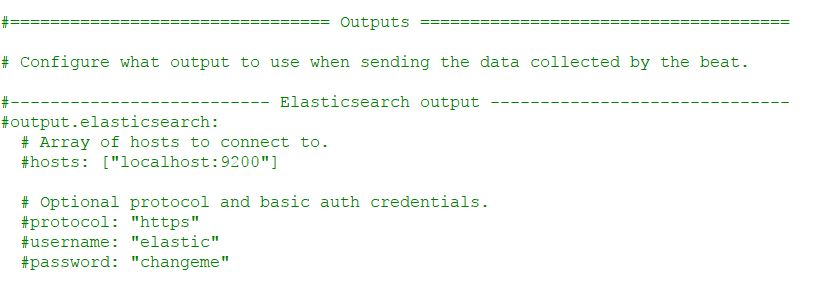
Continue scrolling down the configuration file until you see the section output.elasticsearch. Comment out any of the lines in this section that aren’t already with a “#.” We do not need to use this section as we will be sending our logs to Logstash in this case.
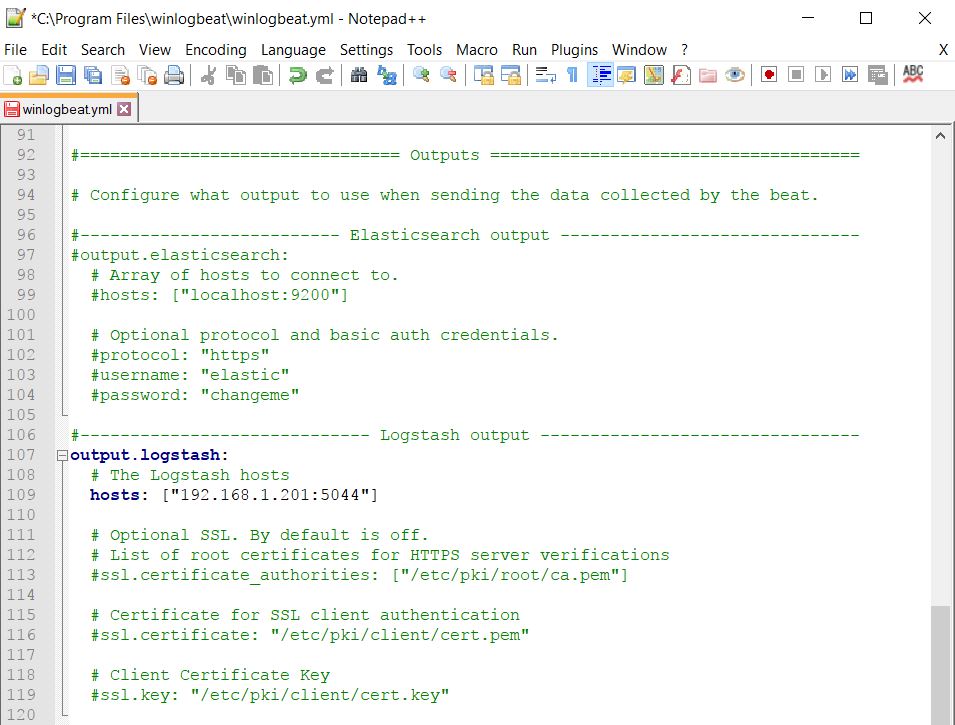
Right below this section is the Logstash part of the configuration. Modify this to send your logs to your Logstash IP address over Port 5044, but leave SSL alone for now. When done, your output section for your Winlogbeat configuration should look similar to this:
Save the file and exit your editor.
Configuring Sysmon
You may have noticed we added Sysmon to the Winlogbeat configuration file without even installing Sysmon yet. Now it is time to do that. Navigate here on your endpoint and download Sysmon.

Extract the contents and move the folder “Sysmon” to the Program Files directory on your endpoint’s C drive. You should now have a screen similar to mine below:

There are two methods we can use from here: default configuration and custom configuration. For the purpose of this post, we will be using the default configuration of Sysmon.
NOTE: There are multiple custom configurations out there, one of the most popular being by SwiftOnSecurity. For more important ELK stacks, a custom configuration is recommended to keep up-to-date on the latest vulnerabilities and attacks Sysmon can help detect.
To setup the default configuration, open a command prompt as administrator and navigate to the Sysmon directory in Program Files. From here run:
sysmon.exe -i -accepteula -h md5,sha256,imphash -l -n
What?
- -i : Install Sysmon (Optionally take a configuration file)
- -h : Specify the hash algorithms
- -l : Log loading of modules
- -n : Log network connections
If the result of the above command looks like mine below, you have successfully enabled Sysmon on your system.

Starting Winlogbeat as a Service
Now that we have everything setup, it is time to get our hands dirty with PowerShell and install Winlogbeat as a service on your endpoint. To do this, open PowerShell as administrator and navigate to the Winlogbeat directory in Program Files.
From here, we first need to temporarily bypass PowerShell’s Execution Policy when it comes to running scripts on your system. To do this run this command:
powershell -ExecutionPolicy Bypass
Now that you can run scripts, run the install-service-winlogbeat.ps1 script in the Winlogbeat directory. If your window looks like mine below, Winlogbeat was successfully installed as a service.

We can test the configuration file we modified previously with this command:
.\winlogbeat.exe -c .\winlogbeat.yml -configtest -e
NOTE: You may get a long list of “depreciated” warnings – this is OK. As long as you see a line resembling “Config OK,” your configuration file should work.
Lastly, start Winlogbeat by using the following command:
start-service winlogbeat
If no errors come up, Winlogbeat should be successfully running. You can also check in the Services application to ensure they are, and also set to run on startup if you so choose.
Check Kibana for Logs!
Now that you have a data shipper sending over logs, navigate to Kibana in a browser using its IP address. As long as you have properly configured Logstash filters on your Logstash node that are set to listen for Beats input and then output that to your Elasticsearch array in an index of your choosing, you should see that index pop up in Kibana under Discover.
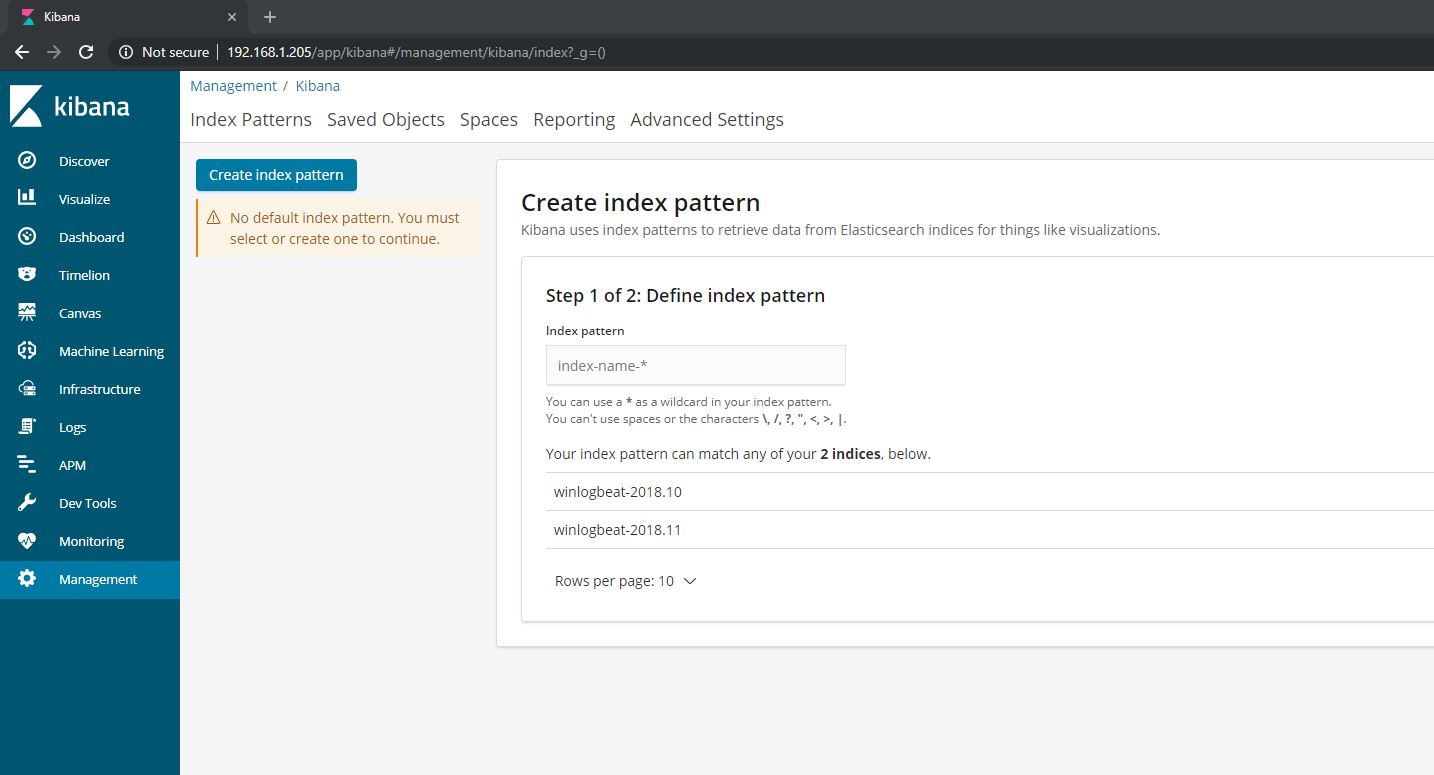
Create an index pattern by in the name “winlogbeat-*” in box labeled Index Pattern. This will create an overall index in Kibana that allows you to see ALL logs related to Winlogbeat, regardless on the month (which they are currently separated by).
Click the Next Step button and use @timestamp as your Time Field filter and then click the Create Index Pattern button to complete the process.

Navigate back to Discover and you should see logs starting to pour through under winlogbeat-*.

If you see this, congrats! You have properly configured an endpoint to send logs to your ELK stack using Winlogbeat and Sysmon.
What’s next?
Play around with your new logs to see just what is being grabbed. Since you may have used a VM as your endpoint (like myself) you may not see a TON of logs, however you should see IP address and hashes start to flow in after some time. Play with filtering and search queries and look to see what else Kibana has to offer. I am hoping to cover how to create dashboards and visualizations with this new data in a later post.

If you have any questions about the process or ideas of where to go from here with Kibana, comment below or contact me! 🙂

It works! 😀 Great writeup. I had only one small issue and it was that my kibana HTTP instance was not listening on port 80 but on port 5601.
LikeLiked by 1 person
Hi Zachary, how would i now proceed and make sure certain “critical” events will be easily viewable in Kibana (for example colored?) – Should i use sysmon/winlogbeat config for this or should it be done on the kibana side? Thanks!!
LikeLike
Jelle, if I am understanding your question correctly, then I believe the best course of action for you would be to find and organize these “critical alerts” on the Kibana side. Winlogbeat and Sysmon, using the files I did, are already configured to grab any and all information you would need. You can then filter for certain events in the Discover view in Kibana under the correct index, such as Event ID 4625 and the hostname of a DC to see all failed logons to your Domain Controller. You could also filter for VPN connections with Application logs and Event ID 20225, etc. The possibilities/combinations are endless, and you can also make visualizations in Kibana using the dashboards feature to make it all pretty if you want – I may make a post about that later. Hope this helps!
LikeLike
Thanks man, very help full!
LikeLiked by 1 person
How do i deal with the Templating done by Winlogbeat-.. As this creates a lot of redundant field with .keywords which was actually aggregatable but the original filed is not
LikeLike