

Previously I had written a guide on Creating a Single-Node ELK Stack; covering what to do when you want create and utilize The Elastic Stack (also formally ELK) on a limited capacity, single-node basis. When assisting my roommate in creating an ELK stack of his own, I realized I had not yet described the process of creating a “multi-node” stack and the additional configurations required. These “multi-node” stacks are what you will most likely see in production environments; more customizable, reliable, and efficient than “single-node” stacks.
This guide will walk you through the setup for a 5-node (3 ES, 1 LS, 1 KB) ELK Stack, explaining the configurations required for these nodes to communicate.
Requirements
To follow this guide exactly, you will need access to the following criteria:
- A virtualization platform (vCenter, VMware Workstation, etc.) to host five different nodes
- Ubuntu 18.04.2 Server (ISO Download)
- OPTIONAL: Endpoints configured to send logs via Winlogbeat to Logstash
Configure your nodes
While ELK is a fully customizable platform, I would recommend your nodes have the following MINIMUM recommended specs:
Elasticsearch – 1 CPU, 4GB RAM, 100GB HDD

Logstash – 4 CPUs, 6GB RAM, 100GB HDD
Kibana – 1 CPU, 2GB RAM, 30GB HDD
NOTE: This guide follows a 5-node format, however this is not the only format available. You can have any combination of nodes to suit your needs, such as 2 Logstash nodes for load-balancing or only 1 Elasticsearch node for storage instead of 3 within an array in this guide.
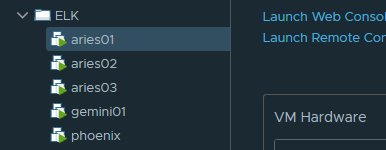
Below you will see my configuration utilizing vCenter; with 3 ES nodes (aries), 1 LS node (gemini), and 1 KB node (phoenix):
Once you have your resources allocated and your node up and running ensure that your OS is up-to-date:
sudo apt-get update

sudo apt-get upgrade
SETTING UP ELASTICSEARCH
The following shows how to correctly configure Elasticsearch for ONE node. You will need to repeat this process for each Elasticsearch node you want to have while making the appropriate changes.
As with a single-node installation of ELK, Java is necessary for both Elasticsearch and Logstash to run. Before installing, check to see if Java is already present on your machine:
java -versionIf Oracle’s Java is not installed, or is not version 8, install it by first adding it’s repository:
sudo add-apt-repository ppa:webupd8team/javaGrab and Install the Java 8 package using this new repository:
sudo apt-get update

sudo apt-get install oracle-java8-installer
Check your Java version again. You should now see that you are running Java 8.
To install any of Elastic’s products, we first need to grab their PGP signing key down to our VM.
wget -qO - https://artifacts.elastic.co/GPG-KEY-elasticsearch | sudo apt-key add -

sudo apt-get install apt-transport-https
Make sure your system is fully up-to-date and install Elasticsearch’s Debian package.
NOTE: To my knowledge, with the introduction of 6.X it became a requirement that all Elastic services working in tandem with one another in a stack are of the same version. It is important that if you install Elasticsearch 6.6.2, that you also install Logstash 6.6.2 – so on and so forth.
echo "deb https://artifacts.elastic.co/packages/6.x/apt stable main" | sudo tee -a /etc/apt/sources.list.d/elastic-6.x.list

sudo apt-get update && sudo apt-get install elasticsearch
Navigate to the newly installed Elasticsearch directory (/etc/elasticsearch) to modify its configuration file, elasticsearch.yml. Root access will be required to access this directory:
sudo su
cd /etc/elasticsearch

nano elasticsearch.yml
From here you have a couple of steps:
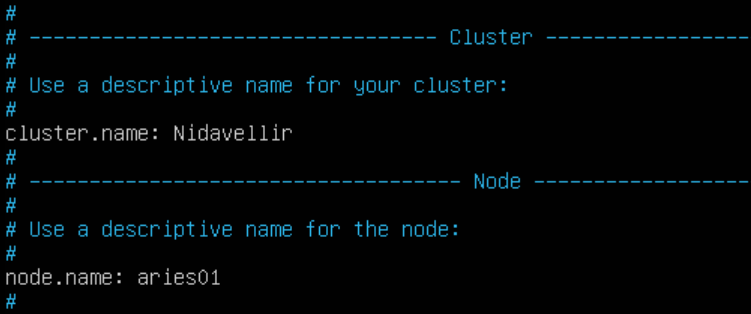
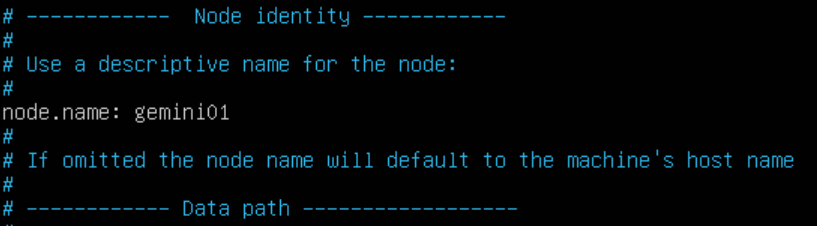
- If you wish to name your cluster, as I have already done below, remove the “#” from the beginning of the line with cluster.name and add your own custom name. Don’t forget to also name your node to be recognizable in Kibana later.
- Take note of the path.logs variable — this is the path where all your log files associated with Elasticsearch will reside. You can change this to be anywhere you want
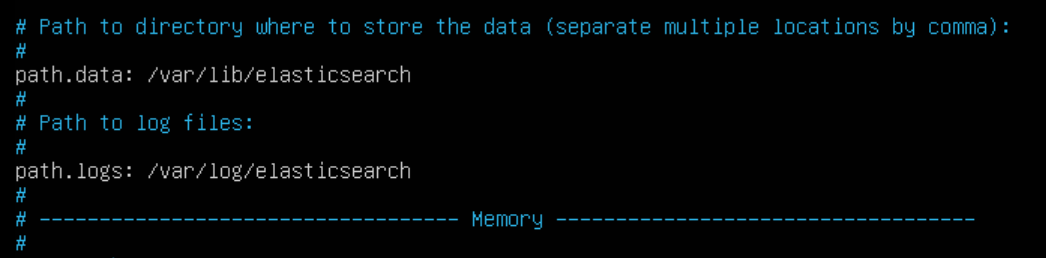
NOTE: I have a blog post on Storing Elasticsearch Data on a Separate Ubuntu Partition to describe how to go about that optional process.
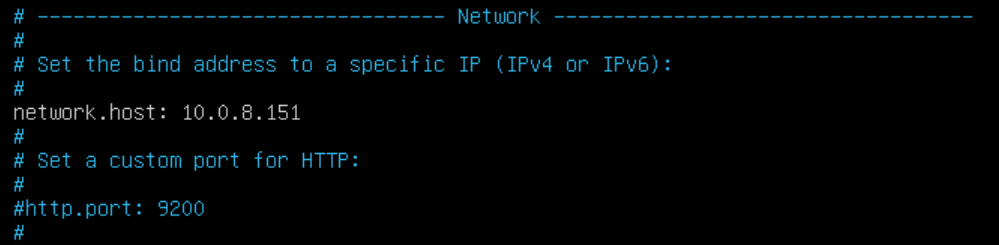
- Navigate to the Network section and look for network.host – this is used to identify your current node. Un-comment out this line if necessary and add the IP address of your current node here:
- Navigate to the Discovery section and look for discovery.zen.ping.unicast.hosts – this is used to identify other Elasticsearch nodes to communicate with. Un-comment out this line if necessary and add the IP addresses of your other desired Elasticsearch nodes here:
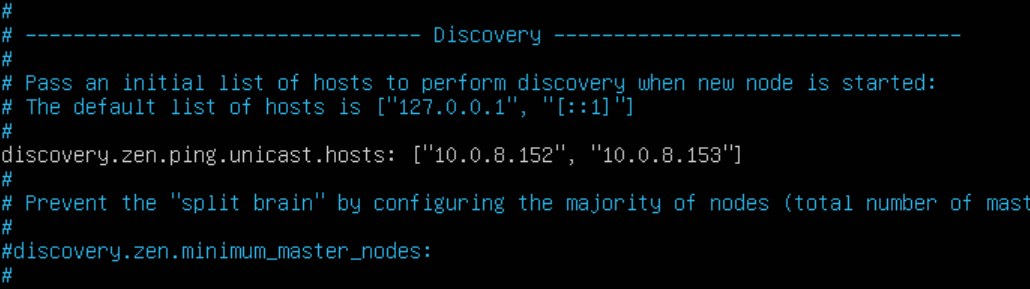
Save the file and exit.
JVM Heap Size
We are going to adjust the JVM settings for Elasticsearch to take full advantage of the resources you gave it. JVM, or Java Virtual Machine, is the platform that both Elasticsearch and Logstash operate off of. I am not going to pretend to understand exactly how it functions, however editing the options file for JVM functionality will allow you to maximize these services’ potentials.
To do this, edit the jvm.options file within the /etc/elasticsearch directory:
nano jvm.optionsBased on recommendation from Elastic themselves, you should NEVER allocate more JVM heap size than HALF of the total allocated RAM to your host machine. In the case of this guide, I allocated 4GB RAM to my Elasticsearch nodes. So, I am going to edit this file by only allocating a min/max JVM heap size of 2GB. If I had 8GB total instead, I would do a min/max JVM heap size of 4GB – so on and so forth:
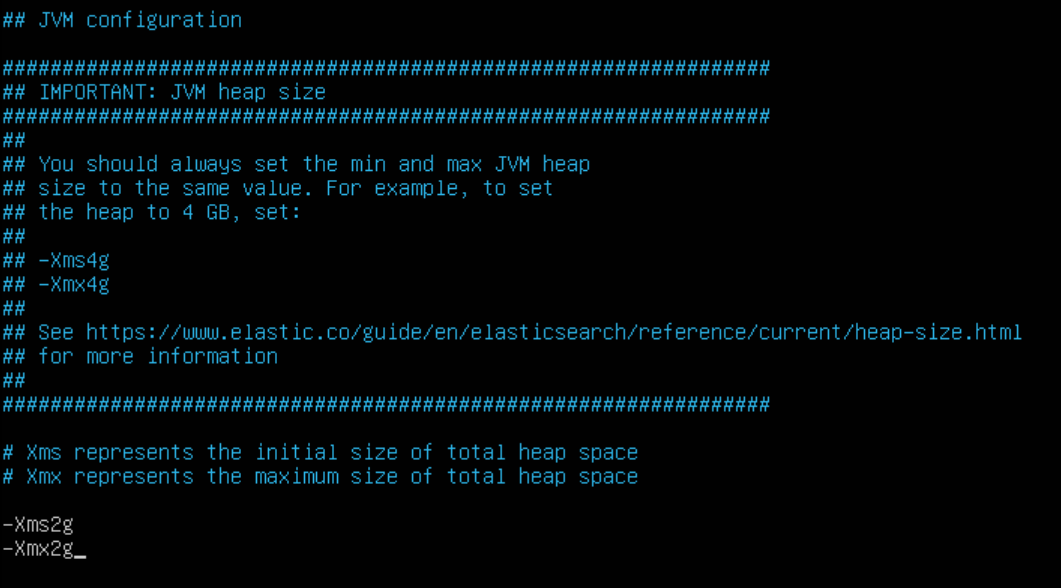
Save and exit the file.
Now that Elasticsearch is configured to how you want, enable and start the service and confirm that it is running:
systemctl enable elasticsearch

systemctl start elasticsearch
systemctl status elasticsearch
REPEAT this process until all your Elasricsearch nodes are configured and the service is confirmed to be functioning.
SETTING UP KIBANA
Kibana is the simplest and quickest to setup, only requiring a few steps.
Start by installing Kibana to its dedicated node using the same repository as Elasticsearch:
echo "deb https://artifacts.elastic.co/packages/6.x/apt stable main" | sudo tee -a /etc/apt/sources.list.d/elastic-6.x.list

sudo apt-get update && sudo apt-get install elasticsearch
sudo apt-get update && sudo apt-get install kibanaOnce installed, navigate to /etc/kibana and edit the kibana.yml file:
cd /etc/kibana

nano kibana.yml
Edit the server.host section and add your Kibana node’s IP Address:
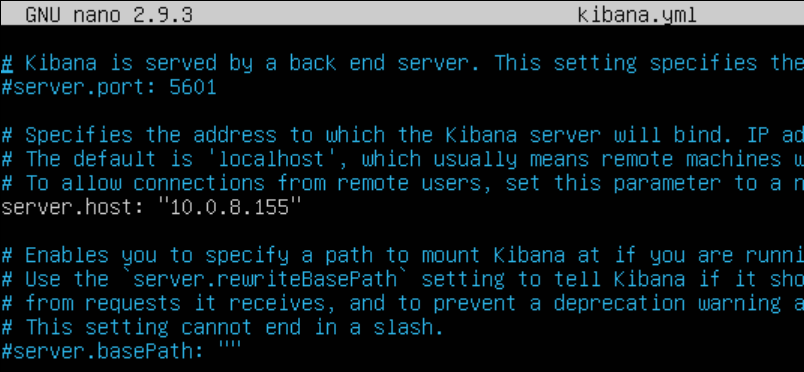
Scroll down until you see elasticsearch.hosts – this is used to tell Kibana the IP addresses of your Elasticsearch nodes to query. Add their IP addresses and ports here:
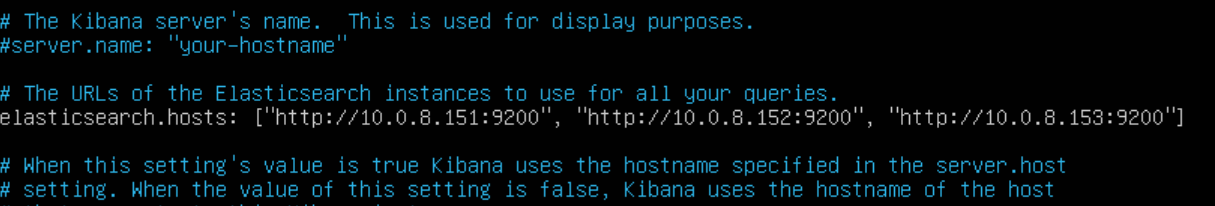
Save the file and exit.

NOTE: You can optionally configure Kibana to work with NGINX to prevent prying eyes from accessing your data inside. I have a blog post on How to Install and Configure NGINX for Kibana that explains more about this optional step.
Now that Kibana is configured, enable and start the service and confirm that it is running:
systemctl enable kibana

systemctl start kibana
systemctl status kibana
SETTING UP LOGSTASH
In my opinion, Logstash is one of the more complex of Elastic’s services and this is where most of the potential problems may occur. This is due to how much goes on concerning this service, coinciding with the delicate role it plays in filtering logs it is receiving from endpoints.
First, ensure Java is installed on the node you wish to place Logstash on. This process is the same as with Elasticsearch and you can just re-follow those steps.
Next, install Logstash to its dedicated node using the same repository as both Elasticsearch and Kibana:
echo "deb https://artifacts.elastic.co/packages/6.x/apt stable main" | sudo tee -a /etc/apt/sources.list.d/elastic-6.x.list

sudo apt-get update && sudo apt-get install elasticsearch
sudo apt-get update && sudo apt-get install logstashNavigate to /etc/logstash and edit the logstash.yml file:
cd /etc/logstash

nano logstash.yml
Give your node a name to be distinguished in Kibana:

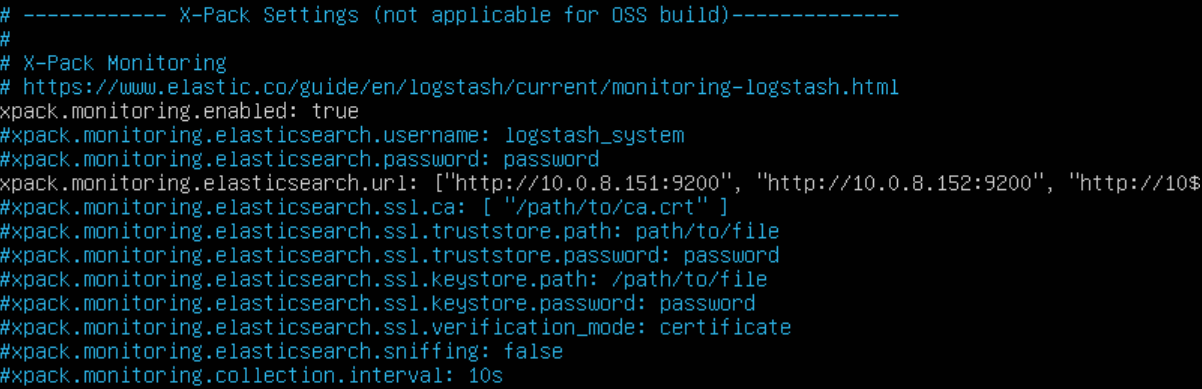
OPTIONAL: To view Logstash stats under the Monitoring tab in Kibana, scroll to the bottom of the file and enable X-Pack Monitoring by un-commenting the following lines and adding in the IP addresses of your Elasticsearch nodes:
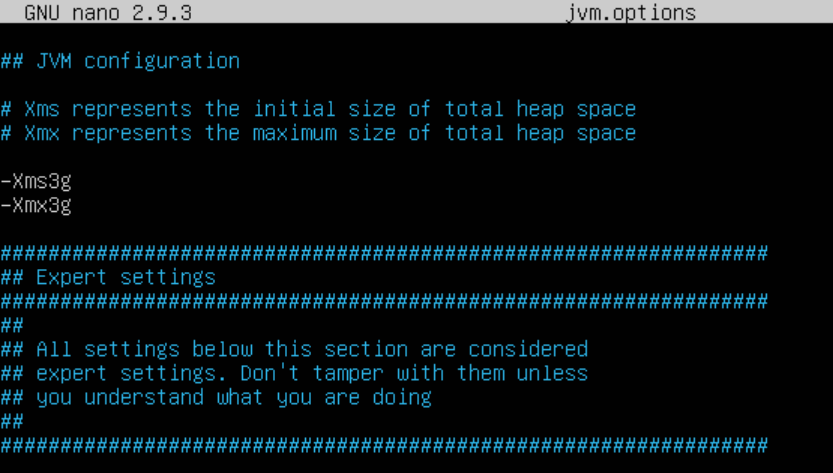
JVM Heap Size
Just as with Elasticsearch, we can configure JVM Heap size to match HALF of the resources we allocated to the host machine. In this guide, I used 6GB of RAM for Logstash, so I will be allocated a min/max JVM Heap size of 3GB.
Edit the jvm.options file within the /etc/logstash directory:
nano jvm.optionsEdit the file accordingly:
Logstash Pipelines
Logstash operates using input and output filters, otherwise known as a log pipeline. For this guide, we are just going to use one simple input/output filter that is specific for grabbing all data being sent by the Beats data shipper known as Winlogbeat to get Logstash going. There are a plethora of different filters out there, and you can always make your own per log type (Security, System, Application, etc.) to help better organize the information Kibana will be seeing.
NOTE: For examples of great filters that I have been adapting my cluster from, I suggest visiting Roberto Rodriguez’s (@Cyb3rWard0g) GitHub page. His HELK Project has great filters that can be found here.
Go to the /etc/logstash/conf.d directory and create a simple beats input filter and enter the following. Mine is called 02-beats-input.conf:
cd /etc/logstash/conf.d

nano 02-beats-input.conf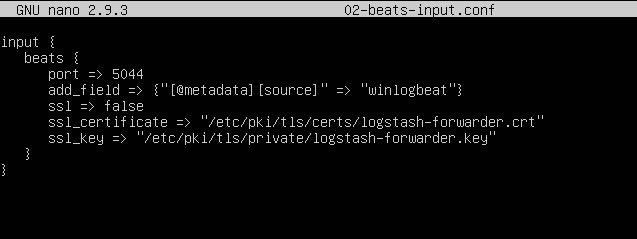
Save and exit the file.
NOTE: You may notice that my above configuration specifies an SSL certificate. You do NOT need to have SSL enabled, however if you have a certificate ready to use then change the paths for the cert and key to match and change “false” to “true.” MAKE SURE TO COMMENT OUT “ssl_certificate” AND “ssl_key” IF NOT USING SSL. If you would like to learn more about setting up Logstash-Endpoint Communication with SSL, I have a blog post about that here.
Create the output file now and enter the following. Mine is called 50-beats-output.conf:
nano 50-beats-output.conf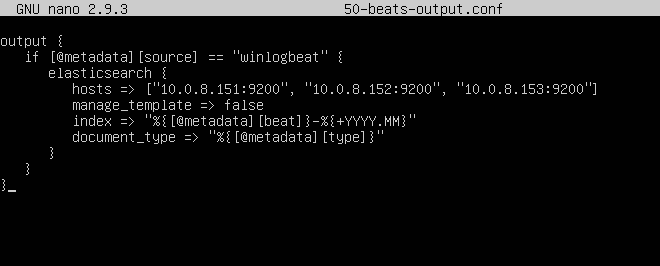
NOTE: In the line starting with “index,” I chose to sort my indices by month (YYYY.MM). This is entirely by choice, and you can adjust the output filter to sort by day (YYYY.MM.dd) as well. I also chose to adopt @Cyb3rWard0g‘s naming scheme as it allows you to easily separate your input and output filters by the number that precedes them. This is why our first input filter is “02” while our first output filter is “50,” as you would normally have many different filters for bigger environments.
Now that Logstash is configured, enable and start up the service and check to ensure it is running:
systemctl enable logstash

systemctl start logstash
systemctl status logstash
If you run into troubles, tail your Logstash logs and troubleshoot from there:
tail /var/log/logstash/logstash-plain.logCONFIGURING KIBANA
Now that you have everything running and setup, navigate to your Kibana web interface by going to your Kibana node’s IP over port 5601 in your web browser. If you setup NGINX, you don’t need to specific a port but you will need to log in with your configured credentials.

NOTE: The following is contingent on you having already configured endpoints sending logs to your Logstash node. If you do not have this done, I have a blog post on Sending Logs to ELK with Winlogbeat and Sysmon that can help you get started before you continue.
Once looking at Kibana, navigate to Management –> Index Patterns –> Create Index Pattern. Not every index shows by default, so this is where all incoming indices will be shown to then be added to Kibana for viewing. In the screenshot below, you will see all of my indices that I have already configured for my home environment through the help of @Cyb3rWard0g‘s HELK filters for Logstash. You should see your winlogbeat index here:
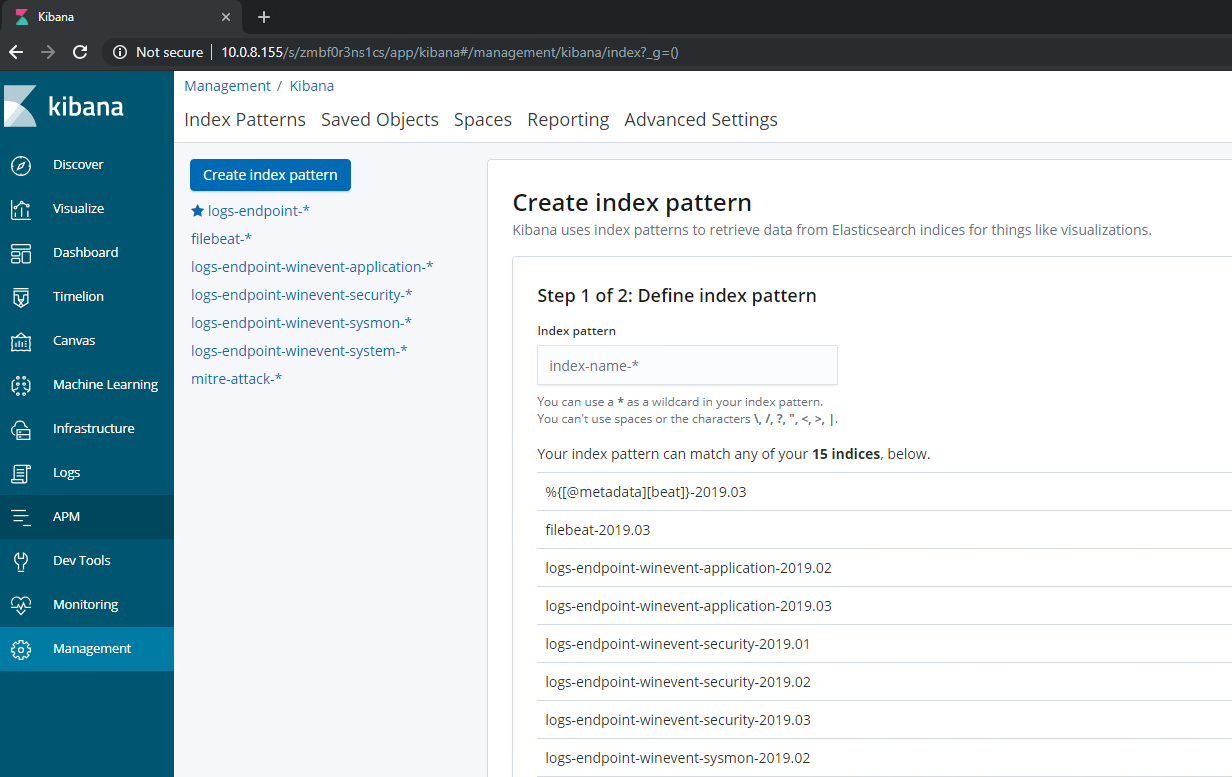
Add the index by utilizing the search field. Type the name of the index but do NOT complete it with the month and day. This will create an index in Kibana that will hold ALL Winlogbeat indices – regardless of month – to view in one place on the Discover page. When selected, filter by @timestamp and complete setup.
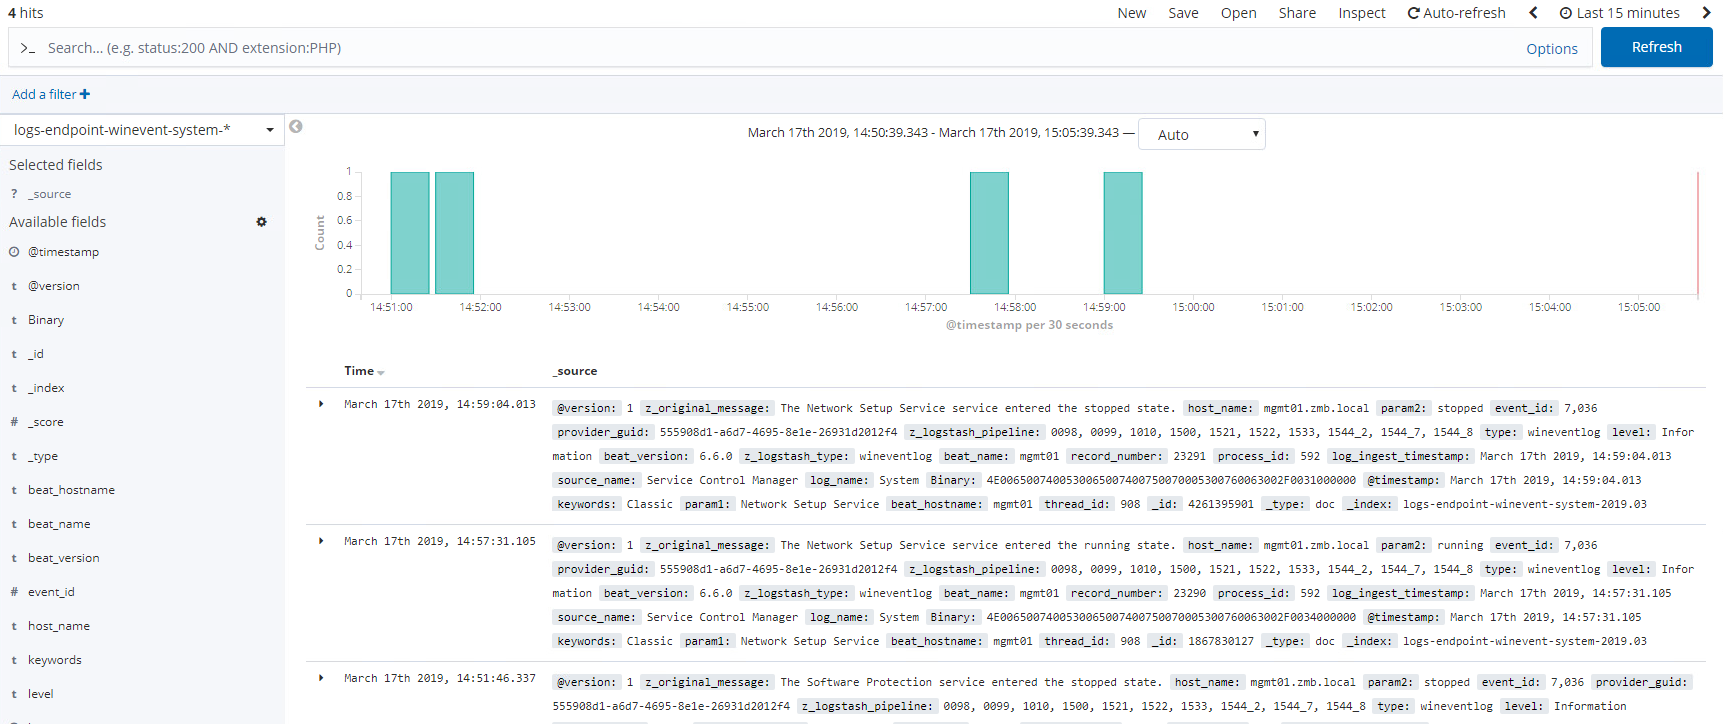
Click the Discover tab and you should see logs like I do for my index below:
Congrats!
You now have a fully functional, multi-node ELK stack. Depending on how you followed the guide, you may have a stack without logs yet, or you may have a stack configured with NGINX and SSL currently ingesting logs. Either way, you should have a solid baseline to move forward from. As always, if there is anything I missed or if you have any comments or questions let me know below or contact me.
You’re welcome, roommate 🙂
Steps to go from here…
- Configure SSL – Securing Communication with Logstash by using SSL
- Configure NGINX – How to Install and Configure NGINX for Kibana
- Configure Winlogbeat – Sending Logs to ELK with Winlogbeat and Sysmon

You trruly performed more than visitors’ anticipation. Thank you for making these helpful,
trusted, edigying and also cool feelings on the topic to be able to Kate.
LikeLike
Hi,
thanks for the info, do you have to have a minimum number of elasticsearch nodes if you wanted to build a multi node elk stack? We new to Elk and building a new stack. I have one elasticsearch node built and working with winlogbeat from one server being sent direct to it.
my question is, can i simply add one more elasticsearch node, so the original becomes the master and the new one is a data node, or do you need to have a minimum of 3 eg, 1 master to 2 data?
Going forward, could we simply add a 3rd data node as and when needed?
thanks in advance
LikeLike
we are only interested in enabling ssl between kibana and elastic as a prerequisite to enable xpack detections for an on-prem system. The concern is that enabling secure comm between elastic and kibana will then require SSL between file beats and direct Syslog ingestions to elastic.
Randy
LikeLike